What's Eating Your Browser Memory? Measuring and Managing Cache Size
Clear Cache Chrome · Tech Product Partners KFT.
Clear Cache Chrome shows cache size trends and logs every cleanup operation — scope, data types, and trigger source — so you can check Chrome cache impact and prove what changed. No more blind clears.
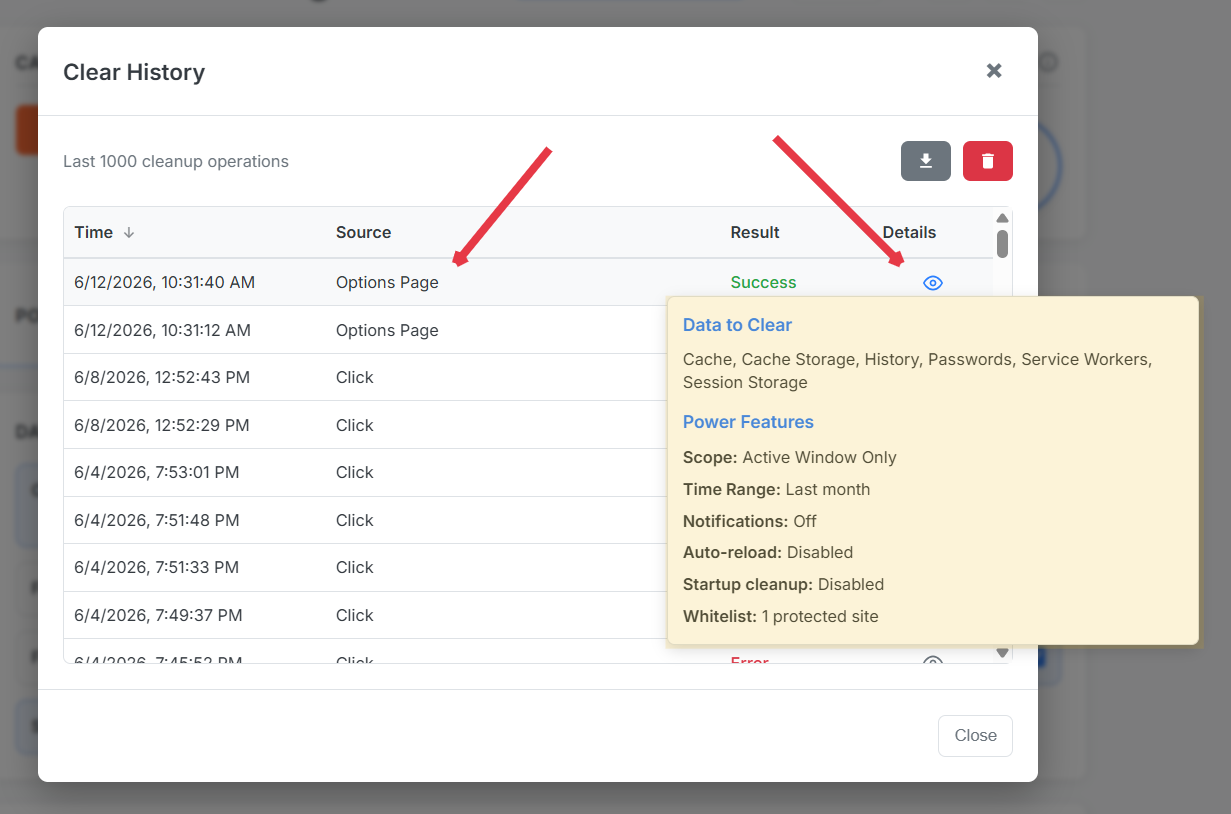
Blind clears create blind spots
Without measurement, teams argue whether cache was actually cleared. Transparency logs end the debate — every run records trigger (shortcut, schedule, manual), scope, and data types.
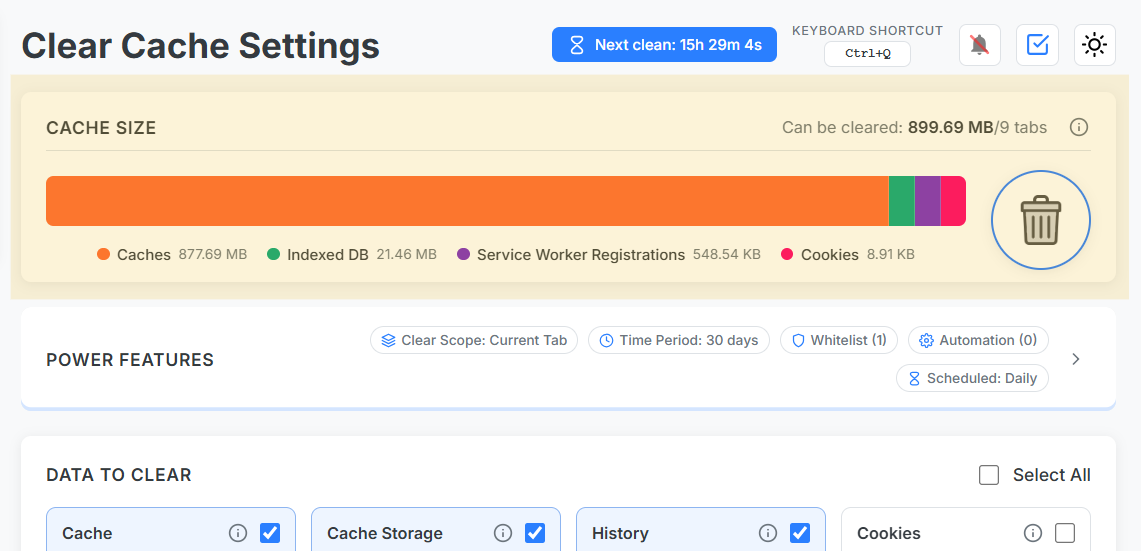
Cache size chart workflow
Check baseline size before sprint work.
Run scoped cleanup.
Compare chart delta and log entry.
Export history for audit trails.
Cache size trends and exportable operation history.
Chrome cache analyzer mindset
Treat cache like disk usage on a server: measure, set retention policy (schedule), alert on anomalies (sudden spikes from one origin). Developers testing video-heavy SPAs often see single-origin bloat exceeding 500 MB.